
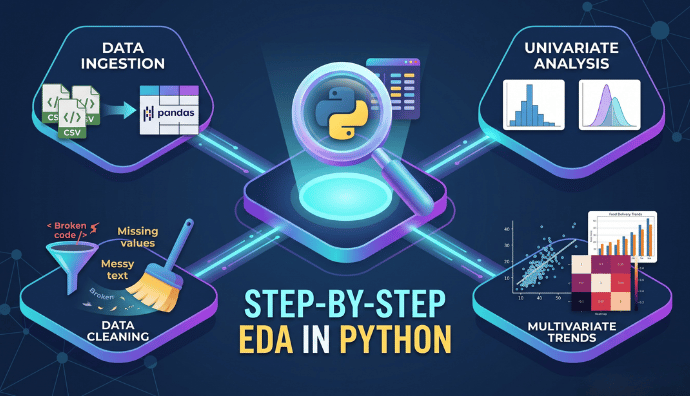
Staring at a raw CSV file with 50,000 rows can feel like looking for a needle in a digital haystack. You know there are valuable insights buried in there, but where do you even start?
Most beginners jump straight into building machine learning models, only to find their predictions are wildly inaccurate. Why? Because they skipped the most critical phase: truly understanding the data. In this guide, you will learn a foolproof, step-by-step framework to perform Exploratory Data Analysis (EDA) in Python, turning chaotic datasets into clear, actionable narratives.
Early in my career, transitioning from optimizing manufacturing pipelines as a production planning engineer to full-fledged data science, I learned a hard truth: skipping the foundational inspection of your inputs guarantees bottlenecks down the line. Whether you are balancing assembly line loads or tuning a neural network, performing rigorous EDA is what separates guesswork from true engineering. Let’s dive in.
What is Exploratory Data Analysis (And Why You Can’t Skip It)
Exploratory Data Analysis in Python is essentially the process of interviewing your data. You are asking questions, looking for patterns, and identifying anomalies before making any assumptions.
If you skip this step, you risk the classic “garbage in, garbage out” scenario. A predictive model trained on uncleaned, unverified data will always fail in a real-world environment.
AI Insight: Modern Agentic AI and coding assistants can help write the boilerplate code for a Python EDA tutorial, but they cannot replace human intuition. AI can plot the graph, but you must ask the right business questions to extract the true value.
Setting Up Your Python Arsenal
Before we analyze anything, we need the right tools. The Python data science ecosystem relies heavily on four foundational libraries:
Pandas: For data manipulation and ingestion.
NumPy: For numerical operations.
Matplotlib: For basic plotting.
Seaborn: For beautiful, statistical data visualization.
Quick Try-It Guide: Open up a Jupyter Notebook or Google Colab and run this quick snippet to get started:
import pandas as pd
import numpy as np
import matplotlib.pyplot as plt
import seaborn as sns

# Set visual style
sns.set_theme(style="darkgrid")
(Need help setting up your environment? Check out our guide on Learn Python for AI and Automation).
Step 1: Data Ingestion and The First Glance
The first step in any exploratory data analysis Python workflow is loading your dataset and taking a quick peek. We use pandas to read our files and inspect the structure.
# Load the dataset
df = pd.read_csv('your_dataset.csv')

# Look at the first 5 rows
print(df.head())

# Understand data types and non-null counts
print(df.info())

# Get summary statistics
print(df.describe())
These three simple commands tell you the shape of your data, the types of variables you are working with (integers, floats, or objects), and the initial statistical spread.
Step 2: Data Cleaning (The Dirty Work)
Data cleaning in Python is where you roll up your sleeves. Real-world data is messy, incomplete, and full of duplicates.
You must first identify missing values. Once found, you have a choice: impute (fill them in using means or medians) or drop them entirely. Next, you standardize your text columns to ensure consistency.
Pro Tip: Automate your missing-value checks with a quick helper function to speed up your pandas EDA workflow:
# Load the dataset
df = pd.read_csv('your_dataset.csv')

# Look at the first 5 rows
print(df.head())

# Understand data types and non-null counts
print(df.info())

# Get summary statistics
print(df.describe())
For authoritative reference on data manipulation methods, always consult the Pandas Official Documentation.
Step 3: Univariate Analysis (Examining One Variable)
Now we analyze variables one at a time. Univariate analysis helps us understand the distribution of individual features.
Categorical Variables: Use count plots to see the frequency of categories.
Numerical Variables: Use histograms and Kernel Density Estimate (KDE) plots to spot skewness or standard distributions.
# Histogram for a numerical column
sns.histplot(df['price'], kde=True)
plt.title('Distribution of Price')
plt.show()
Step 4: Bivariate and Multivariate Analysis (Finding Relationships)
This is where data visualization with Seaborn shines. Bivariate and multivariate analysis uncovers how different variables interact with each other. We use correlation matrices, heatmaps, scatter plots, and pair plots to map these multidimensional trends.
Real Example: When I recently performed an end-to-end EDA on the Kaggle FoodHub trends dataset, I used Seaborn pair plots to instantly visualize how delivery times, order costs, and customer ratings interacted across different days of the week. This visualization immediately highlighted that weekend orders spiked in cost but suffered slightly in delivery speed.
# Correlation Heatmap
plt.figure(figsize=(10,8))
sns.heatmap(df.corr(), annot=True, cmap='coolwarm')
plt.title('Correlation Matrix')
plt.show()
(Looking for datasets to practice on? Check out Kaggle Competitions for real-world scenarios, or browse our list of Data Science Project Ideas).
Step 5: Outlier Detection and Treatment
Outliers can heavily skew your machine learning models. We locate them by understanding the Interquartile Range (IQR) and using box plots.
# Boxplot for outlier detection
sns.boxplot(x=df['numerical_column'])
plt.show()
Note: Context is king. An outlier in a housing dataset might just be a mansion, which is valid data. An outlier in human age showing 150 years is an error. Knowing when to drop an outlier and when to keep it defines your expertise.
Next Steps: Transitioning from EDA to Feature Engineering
Once your exploratory data analysis in Python is complete, you don’t just stop. The insights you gathered dictate the new features you will create. If you noticed that date and time heavily influence your target variable, your next step is feature engineering—breaking that timestamp into “Day of Week” or “Is_Weekend” columns to prepare the polished dataset for machine learning.
FAQs ~
What is the main purpose of Exploratory Data Analysis (EDA)?
EDA is used to discover patterns, spot anomalies, test hypotheses, and check assumptions using summary statistics and graphical representations before building machine learning models.
Which Python libraries are best for EDA?
Pandas is essential for data manipulation, while Matplotlib and Seaborn are the industry standards for generating clear, statistical data visualizations.
How long should EDA take in a data science project?
While it varies, EDA and data cleaning often take up to 60-70% of a data professional’s time, as the quality of the insights directly determines the success of the project.
Can AI automate Exploratory Data Analysis?
AI tools can automate the generation of boilerplate code and standard charts, but human domain expertise is still required to interpret the context of the data, especially regarding outliers and missing values.
Conclusion
We’ve journeyed from loading a chaotic CSV file to performing deep, multivariate analysis and outlier detection. EDA is not just a preliminary checklist; it is the core investigative process that defines you as a competent data professional. By mastering data cleaning in Python and data visualization with Seaborn, you lay the groundwork for highly accurate, reliable machine learning models.
💡 Want to explore more AI tools and automation tutorials? Visit analyticswithnaban.com for hands-on learning and resources.
Explore more AI tools, data science tutorials, and automation guides at AnalyticsWithNabaN. Stay ahead in the tech-driven world!
You may also like to read ~